NJ Property Tax Increase by Town, 2015–2025
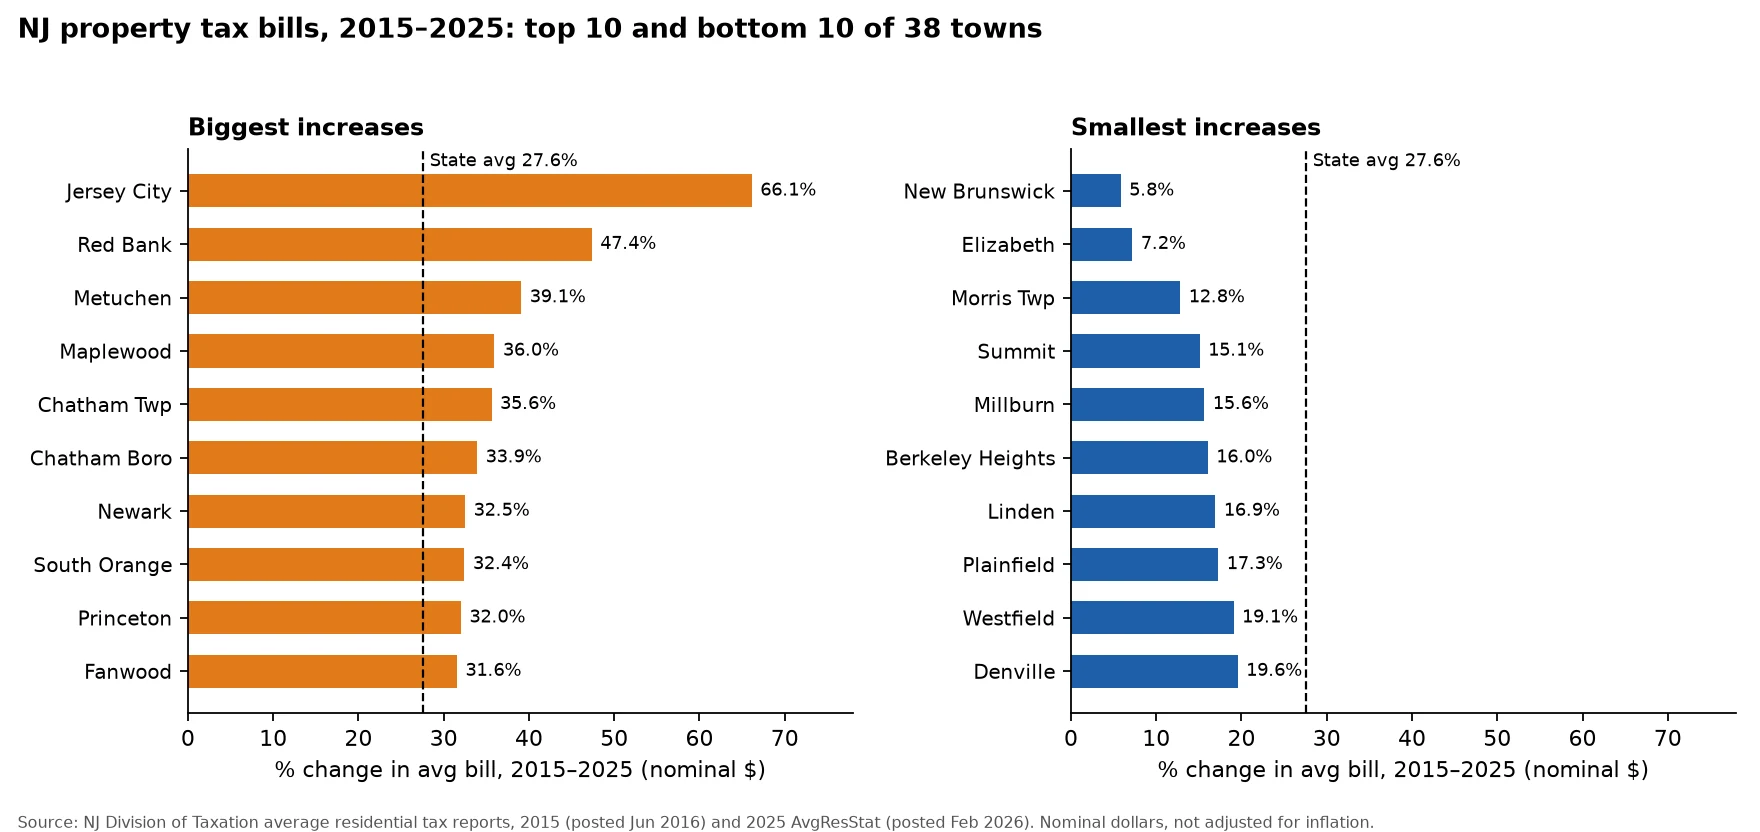
Across 38 NJ towns, the average residential tax bill rose between 5.8% (New Brunswick) and 66.1% (Jersey City) from 2015 to 2025. The state average rose 27.6%, from $8,106 to $10,340.
Source: NJ Division of Taxation average residential tax reports, tax years 2015 and 2025. All figures are nominal dollars, not adjusted for inflation. 2026 bills aren't certified yet.
Quick read
- 14 of 38 towns rose faster than the state average (27.6%). The middle town rose 24.1%.
- Biggest jumps: Jersey City (+66.1%), Red Bank (+47.4%), Metuchen (+39.1%), Maplewood (+36.0%), Chatham Twp (+35.6%).
- Smallest: New Brunswick (+5.8%), Elizabeth (+7.2%), Morris Twp (+12.8%).
- Biggest dollar increase: Princeton, +$5,669 a year. Smallest: New Brunswick, +$391.
- A small percent change can still be a big bill. The 2025 effective rate (the last column) shows what each town charges relative to home value, from 1.07% in Hoboken to 2.60% in Cherry Hill.
All 38 towns, sorted by % change
Click a town for its page. The table is sorted from the biggest increase down.
| Town | County | 2015 avg bill | 2025 avg bill | $ change | % change | 2025 effective rate |
|---|---|---|---|---|---|---|
| Jersey City | Hudson | $6,773 | $11,252 | +$4,479 | +66.1% | 1.85% |
| Red Bank | Monmouth | $7,422 | $10,937 | +$3,515 | +47.4% | 1.78% |
| Metuchen | Middlesex | $9,935 | $13,819 | +$3,884 | +39.1% | 2.37% |
| Maplewood | Essex | $14,255 | $19,380 | +$5,125 | +36.0% | 2.43% |
| Chatham Twp | Morris | $13,548 | $18,373 | +$4,825 | +35.6% | 1.52% |
| Chatham Boro | Morris | $12,664 | $16,960 | +$4,296 | +33.9% | 1.53% |
| Newark | Essex | $5,766 | $7,641 | +$1,875 | +32.5% | 1.84% |
| South Orange | Essex | $17,156 | $22,720 | +$5,564 | +32.4% | 2.47% |
| Princeton | Mercer | $17,704 | $23,373 | +$5,669 | +32.0% | 1.81% |
| Fanwood | Union | $11,219 | $14,759 | +$3,540 | +31.6% | 2.25% |
| Cranford | Union | $10,524 | $13,729 | +$3,205 | +30.5% | 2.11% |
| Woodbridge | Middlesex | $7,423 | $9,597 | +$2,174 | +29.3% | 2.23% |
| Union Twp | Union | $8,402 | $10,849 | +$2,447 | +29.1% | 2.27% |
| Madison | Morris | $12,343 | $15,897 | +$3,554 | +28.8% | 1.53% |
| Bridgewater | Somerset | $8,645 | $10,964 | +$2,319 | +26.8% | 1.83% |
| Montclair | Essex | $17,783 | $22,489 | +$4,706 | +26.5% | 2.16% |
| Scotch Plains | Union | $12,562 | $15,818 | +$3,256 | +25.9% | 2.14% |
| Rahway | Union | $8,314 | $10,435 | +$2,121 | +25.5% | 2.54% |
| Livingston | Essex | $14,880 | $18,469 | +$3,589 | +24.1% | 1.88% |
| Fair Lawn | Bergen | $10,013 | $12,418 | +$2,405 | +24.0% | 2.20% |
| Cherry Hill | Camden | $8,016 | $9,869 | +$1,853 | +23.1% | 2.60% |
| Montville | Morris | $11,718 | $14,423 | +$2,705 | +23.1% | 1.93% |
| Hoboken | Hudson | $7,754 | $9,531 | +$1,777 | +22.9% | 1.07% |
| Edison | Middlesex | $8,623 | $10,585 | +$1,962 | +22.8% | 2.00% |
| Morristown | Morris | $9,202 | $11,181 | +$1,979 | +21.5% | 1.68% |
| Bernards Twp | Somerset | $12,114 | $14,715 | +$2,601 | +21.5% | 1.71% |
| New Providence | Union | $13,364 | $16,231 | +$2,867 | +21.5% | 2.05% |
| Bloomfield | Essex | $10,355 | $12,381 | +$2,026 | +19.6% | 2.39% |
| Denville | Morris | $9,585 | $11,459 | +$1,874 | +19.6% | 1.95% |
| Westfield | Union | $15,914 | $18,948 | +$3,034 | +19.1% | 1.81% |
| Plainfield | Union | $8,318 | $9,755 | +$1,437 | +17.3% | 2.46% |
| Linden | Union | $8,408 | $9,832 | +$1,424 | +16.9% | 2.04% |
| Berkeley Heights | Union | $12,197 | $14,154 | +$1,957 | +16.0% | 1.82% |
| Millburn | Essex | $22,740 | $26,298 | +$3,558 | +15.6% | 1.57% |
| Summit | Union | $17,117 | $19,701 | +$2,584 | +15.1% | 1.48% |
| Morris Twp | Morris | $9,969 | $11,247 | +$1,278 | +12.8% | 1.55% |
| Elizabeth | Union | $9,074 | $9,727 | +$653 | +7.2% | 2.11% |
| New Brunswick | Middlesex | $6,710 | $7,101 | +$391 | +5.8% | 2.09% |
| New Jersey (state average) | — | $8,106 | $10,340 | +$2,234 | +27.6% | — |
Bills are average residential tax bills from the Division of Taxation. 2015 is the report posted Jun 2016. 2025 is AvgResStat, posted Feb 2026. Effective rate is the 2025 rate as a percent of true value (posted Jan 2026). Denville and Bloomfield both round to +19.6%; Denville is a hair lower, so it makes the bottom 10 and Bloomfield doesn't.
Why bills jump
Your bill is your home's assessed value times the town's tax rate. Both can move. Here's what moves them.
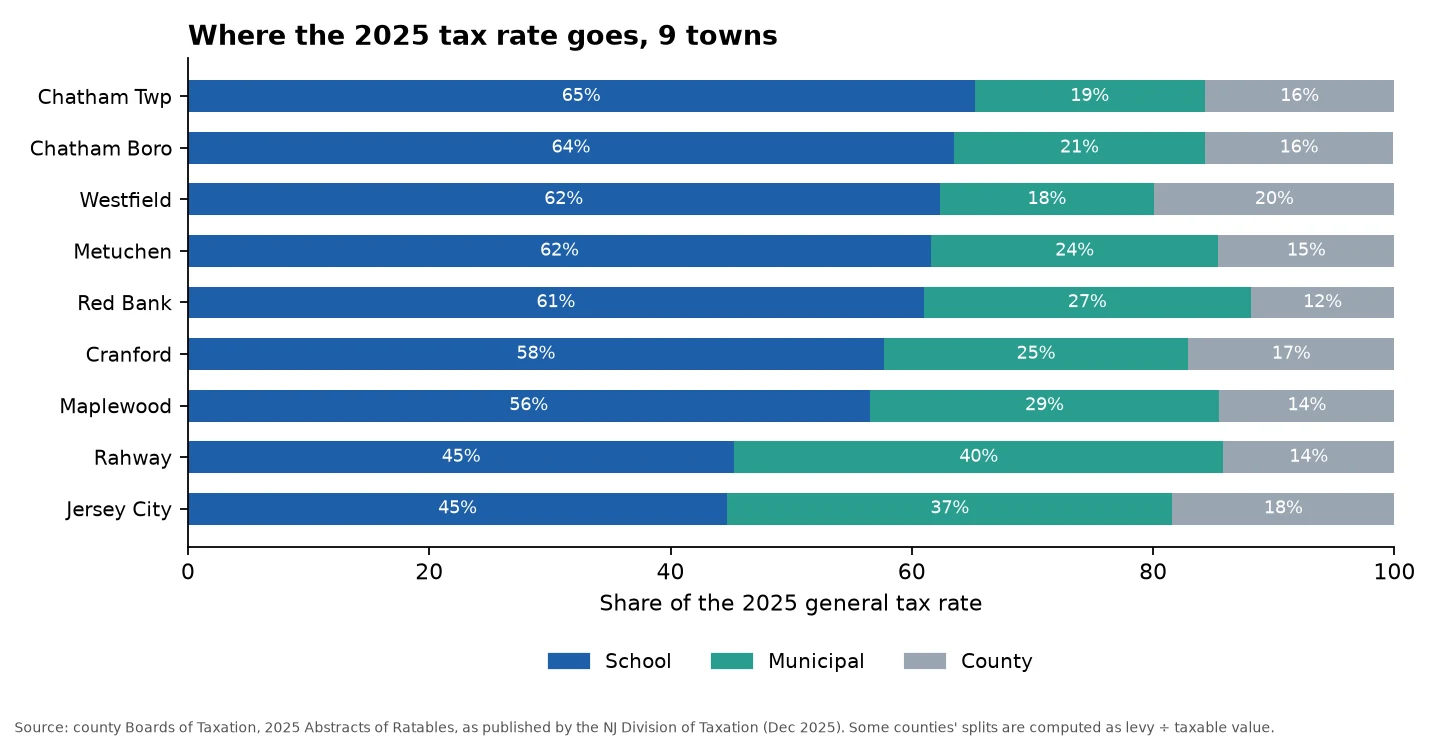
1. Budgets set the rate. Each year the school district, the county and the town decide how many dollars to raise. The rate is those dollars spread across all taxable property. School budgets are the biggest piece: in 33 of the 38 towns, schools take the largest share of the rate, from 19% to 68% of it across the group (2025).
2. The 2% levy cap limits growth, with exceptions. State law limits how much a town or school district can raise through property tax from one year to the next. The base limit is 2%. Several things sit outside it:
- Town budgets: new construction (new ratables), debt service and other capital costs, pension contributions above 2%, health-care cost increases above 2% (up to the State Health Benefits Program increase), and emergency costs. Towns can also use unused cap room from earlier years.
- School budgets: enrollment growth, health-care and certain pension increases, and debt service. Voters can approve extra spending through separate ballot questions, but not for programs needed to meet state learning standards.
- The cap applies to the total levy, not to any one home's bill. One home's bill can still rise faster than 2%, for example when its assessment rises faster than the rest of town's.
3. Revaluations reset assessments. A revaluation updates every property in town to current market value. The Division of Taxation says it doesn't automatically raise taxes: it redistributes the tax burden and the rate adjusts. Big one-year jumps in a town's average bill often coincide with a revaluation, but the bill alone can't tell you the cause. We don't have the revaluation years for these towns, so we don't name a cause for any town above.
Your bill vs the average
The average is a town-wide number. Yours depends on your own assessment.
- Assessment: compare your assessed value with what similar homes sell for. After a revaluation, an old assessment can change a lot.
- Buying: ask the town's tax assessor how a sale at your price would be treated before you rely on the current owner's bill.
- Rate vs bill: a town with a low rate can have a high bill if homes are worth more. Westfield and Rahway show it: compare the rate column with the bill column in the table.
Check a town's page for due dates and appeal deadlines: Metuchen · Maplewood · Chatham Borough · Chatham Township · Jersey City · Red Bank · Rahway · Cranford · Westfield.
Estimate your own monthly cost
The monthly cost calculator puts taxes next to the mortgage, commute and rent. Try Maplewood, Red Bank or Rahway. For current rates in each town, see NJ property tax rates by town. Thinking of an appeal? A guide is planned: how to appeal your NJ property tax assessment. More on taxes in the property tax hub.
Methodology
- Towns: the 38 NJ towns in our data set.
- Bill: the town's average residential tax bill for the tax year, as published by the NJ Division of Taxation.
- % change: (2025 bill − 2015 bill) ÷ 2015 bill. Computed here, rounded to one decimal.
- Nominal dollars: no inflation adjustment. We don't have a sourced CPI series in our data, so there is no inflation-adjusted column.
- State average: the Division of Taxation's state total for each year.
- Two report series: 2015–2021 come from the Division's Average Residential Tax Bill reports. 2022–2025 come from its AvgResStat reports. For every town and year, the general tax rate times the average assessment, divided by 100, matches the average bill within 0.02%, which checks that each file describes the same tax year.
- As published: the 2018 statewide average ($8,117) is lower than 2017 and 2019 in the state's own file. We kept it as published. It doesn't affect the 2015 and 2025 comparison.
- Effective rate: 2025, percent of true value. It lets you compare towns. It doesn't compute your bill.
- Not included: 2026 bills and rates (NJ hasn't certified them), revaluation years, and inflation-adjusted figures.
Sources
- NJ Division of Taxation, average residential tax reports, by year:
- 2015: 2015AvgResTax.pdf, file posted Jun 2016
- 2016: 2016AvgResTax.pdf, file posted Jun 2017
- 2017: 2017AvgResTax.pdf, file posted Jun 2018
- 2018: 2018AvgResTax.pdf, file posted Feb 2021
- 2019: 2019AvgResTax.pdf, file posted Jun 2021
- 2020: 2020AvgResTax.pdf, file posted May 2022
- 2021: 2021AvgResTax.pdf, file posted Dec 2023
- 2022: 2022AvgResStat.pdf, file posted Sep 2025
- 2023: 2023AvgResStat.pdf, file posted Dec 2025
- 2024: 2024AvgResStat.pdf, file posted Sep 2025
- 2025: 2025AvgResStat.pdf, file posted Feb 2026
- NJ Division of Taxation, 2025 General Tax Rates table, posted Jan 2026 (effective rates)
- County Boards of Taxation, 2025 Abstracts of Ratables, as published by NJ Division of Taxation, e.g. Union County 2025, posted Dec 2025 (rate split)
- N.J.S.A. 40A:4-45.45, cap on local tax levy and exclusions
- NJ Department of Community Affairs, Local Finance Notice 2025-14 (CY 2026 cap information)
- P.L. 2010, c.44, school district budget limits; N.J.S.A. 18A:7F-38, current text
- N.J.A.C. 6A:23A-12.1, voter authorization to exceed the school levy limit
- NJ Division of Taxation, Revaluations and Standards for Valuing Property
2026 tax rates and average bills aren't certified yet. We'll update this guide when the Division publishes them.