NJ's Highest Property Tax Bill Isn't the Highest Tax Rate
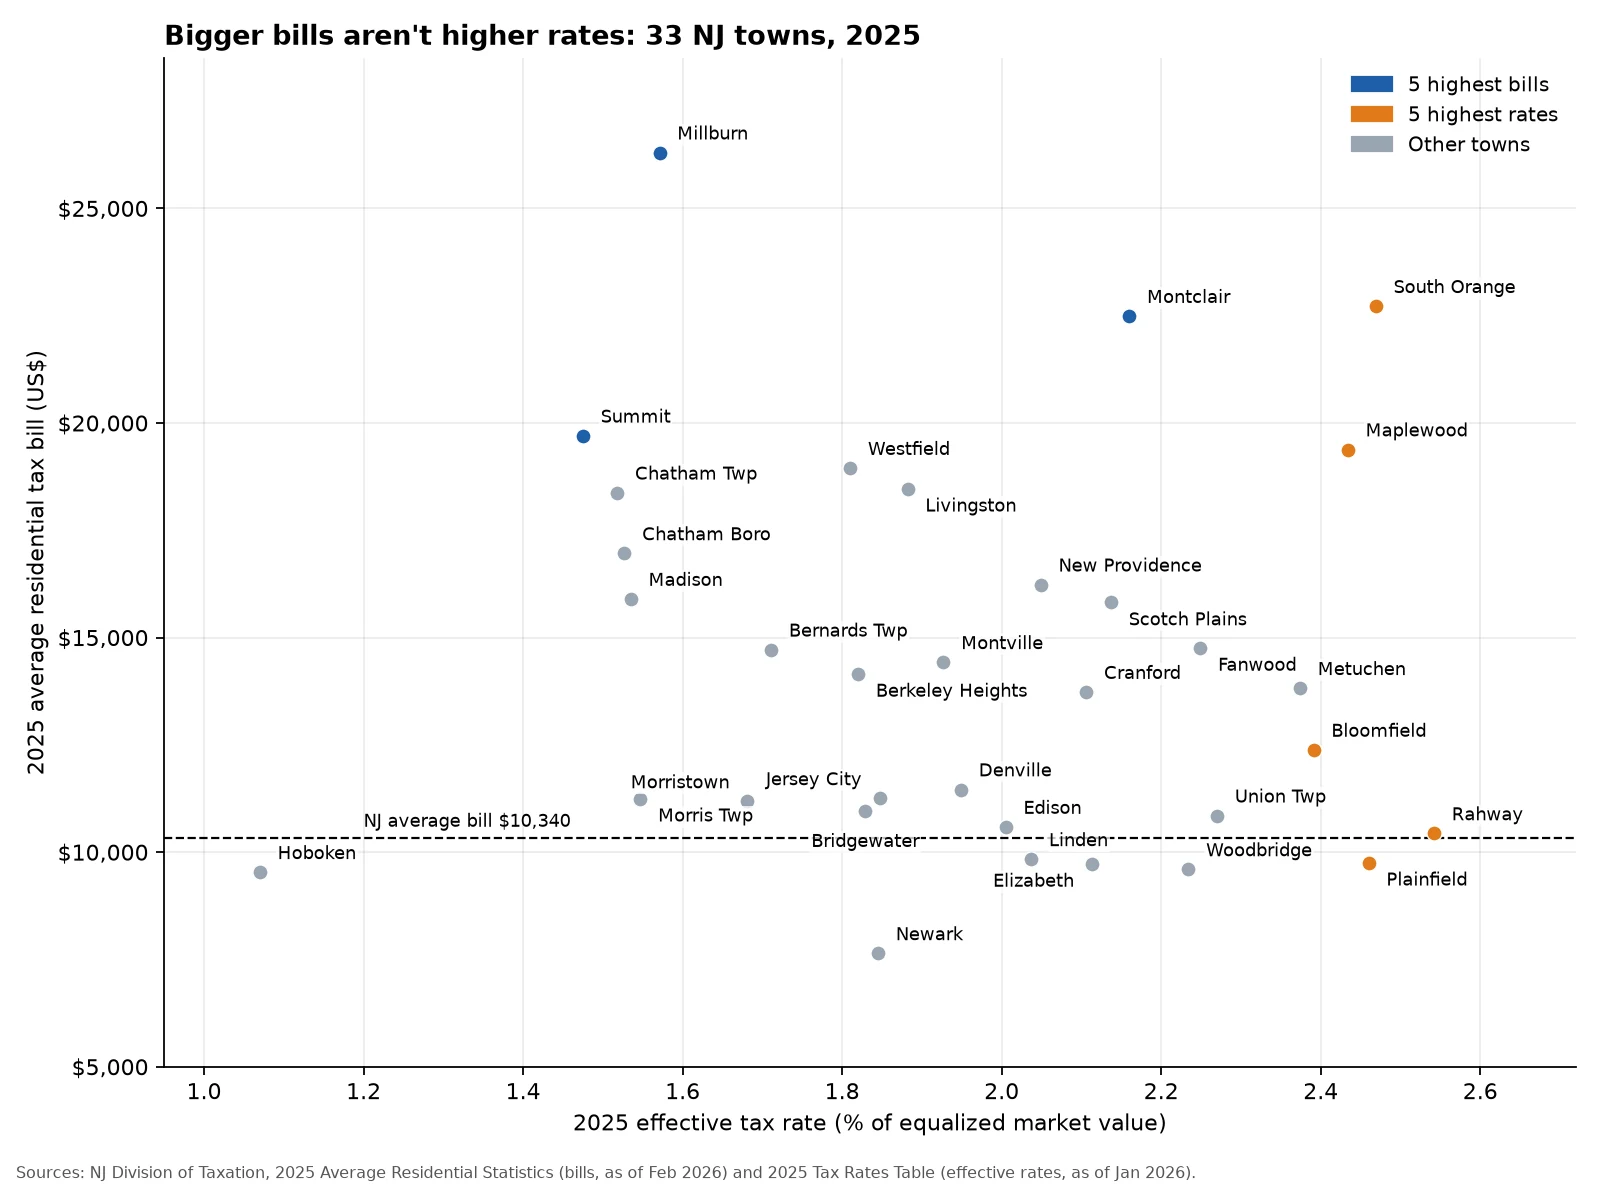
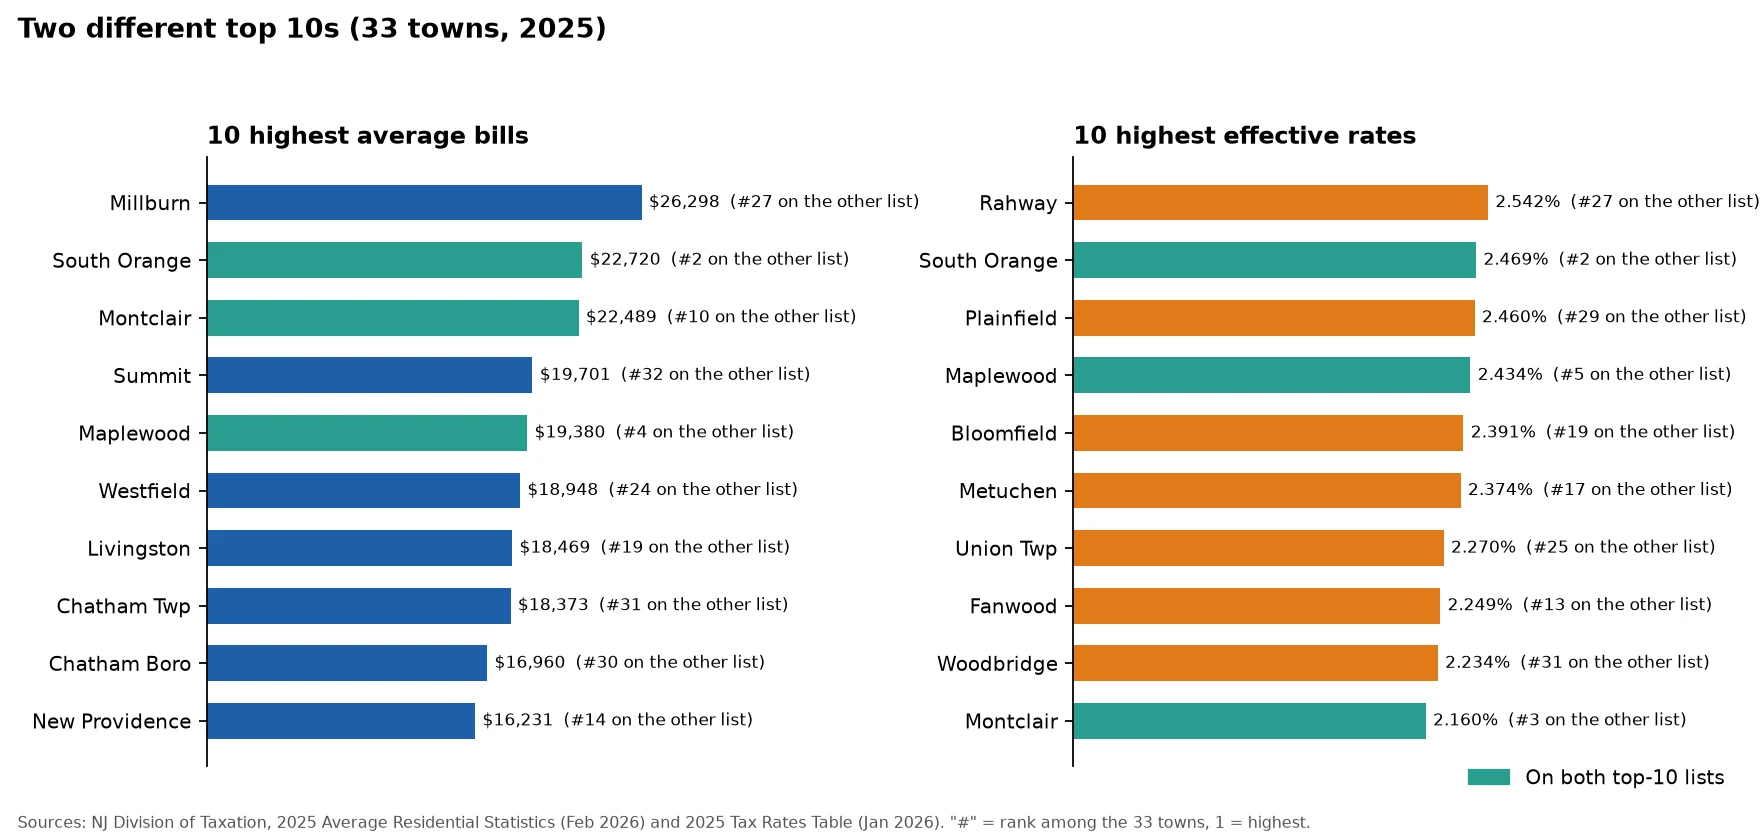
Millburn has the biggest average tax bill of the 33 towns in this comparison: $26,298 a year, at a 1.571% effective rate. Rahway has the highest rate: 2.542%, on a $10,435 bill.
Both numbers are NJ Division of Taxation figures for tax year 2025. They measure different things, so the rankings don't match.
Bill vs. rate in plain terms
- The bill is the average residential tax bill in the town for 2025, in dollars.
- The effective rate is the tax as a share of the town's equalized market value. The Division equalizes towns to full market value so they can be compared. It is not used to work out a bill.
- A bigger bill usually reflects a higher-valued home. A lower rate on a pricier home can still mean a much bigger bill.
- Example: Millburn's bill is 2.5 times Rahway's ($26,298 vs $10,435). Its rate is about 62% of Rahway's (1.571% vs 2.542%).
Quick read
- Highest bill: Millburn, $26,298 (rate rank 27 of 33).
- Highest rate: Rahway, 2.542% (bill rank 27 of 33).
- Lowest rate: Hoboken, 1.070% (bill rank 32).
- Lowest bill: Newark, $7,641 (rate rank 21).
- Only 3 towns (South Orange, Montclair, Maplewood) are on both lists.
- 27 of the 33 bills are above the NJ average of $10,340 (2025 state total, same series). The median bill across the 33 towns is $13,819 and the median rate is 1.949%. Each median is worked out separately.
All 33 towns, sorted by bill
Rank 1 is the highest. Click a town for its page.
| Bill rank | Town | Avg bill, 2025 | Effective rate, 2025 | Rate rank |
|---|---|---|---|---|
| 1 | Millburn | $26,298 | 1.571% | 27 |
| 2 | South Orange | $22,720 | 2.469% | 2 |
| 3 | Montclair | $22,489 | 2.160% | 10 |
| 4 | Summit | $19,701 | 1.475% | 32 |
| 5 | Maplewood | $19,380 | 2.434% | 4 |
| 6 | Westfield | $18,948 | 1.810% | 24 |
| 7 | Livingston | $18,469 | 1.882% | 19 |
| 8 | Chatham Twp | $18,373 | 1.518% | 31 |
| 9 | Chatham Boro | $16,960 | 1.527% | 30 |
| 10 | New Providence | $16,231 | 2.049% | 14 |
| 11 | Madison | $15,897 | 1.535% | 29 |
| 12 | Scotch Plains | $15,818 | 2.137% | 11 |
| 13 | Fanwood | $14,759 | 2.249% | 8 |
| 14 | Bernards Twp | $14,715 | 1.711% | 25 |
| 15 | Montville | $14,423 | 1.927% | 18 |
| 16 | Berkeley Heights | $14,154 | 1.820% | 23 |
| 17 | Metuchen | $13,819 | 2.374% | 6 |
| 18 | Cranford | $13,729 | 2.106% | 13 |
| 19 | Bloomfield | $12,381 | 2.391% | 5 |
| 20 | Denville | $11,459 | 1.949% | 17 |
| 21 | Jersey City | $11,252 | 1.847% | 20 |
| 22 | Morris Twp | $11,247 | 1.547% | 28 |
| 23 | Morristown | $11,181 | 1.681% | 26 |
| 24 | Bridgewater | $10,964 | 1.829% | 22 |
| 25 | Union Twp | $10,849 | 2.270% | 7 |
| 26 | Edison | $10,585 | 2.005% | 16 |
| 27 | Rahway | $10,435 | 2.542% | 1 |
| 28 | Linden | $9,832 | 2.037% | 15 |
| 29 | Plainfield | $9,755 | 2.460% | 3 |
| 30 | Elizabeth | $9,727 | 2.113% | 12 |
| 31 | Woodbridge | $9,597 | 2.234% | 9 |
| 32 | Hoboken | $9,531 | 1.070% | 33 |
| 33 | Newark | $7,641 | 1.845% | 21 |
What this doesn't tell you
- It doesn't say why a town's bill or rate is what it is.
- A town average isn't your bill. Your bill depends on your home's assessment.
- These 33 towns aren't a sample of all NJ towns.
- 2026 bills and rates aren't certified yet, so this is tax year 2025.
Next steps: the monthly cost calculator puts a town's tax next to rent, mortgage and commute. Try Millburn, Rahway or Hoboken. For how bills changed over time, see NJ property tax increase by town, 2015–2025. For commuters, see NJ towns with a direct train to NYC. More on taxes in the property tax hub.
Methodology
- Towns: this comparison covers 33 NJ towns, a fixed set. Data as of Feb 2026 (bills) and Jan 2026 (rates), checked Nov 1, 2026.
- Bill: average residential tax bill, tax year 2025, from the Division's Average Residential Statistics.
- Rate: effective tax rate, 2025, percent of true (market) value, from the Division's Tax Rates Table. The Division's table is used, not county abstracts, which can print slightly different effective rates.
- Ranks: 1 = highest of the 33. No two towns tie on bill or rate.
- State average: $10,340, the 2025 State Total line in the same Division series.
- Left out: assessments, home prices, 2026 figures (not yet certified), and any cause for differences between towns.
Sources
- NJ Division of Taxation, 2025 Average Residential Statistics, as of Feb 2026
- NJ Division of Taxation, 2025 Tax Rates Table, as of Jan 2026
- Data file: town-data.json v2.5.3, updated 2026-11-01T21:33:02-05:00
Rates compare towns. They don't calculate your bill. Check your own tax bill and assessment with your town's tax office.